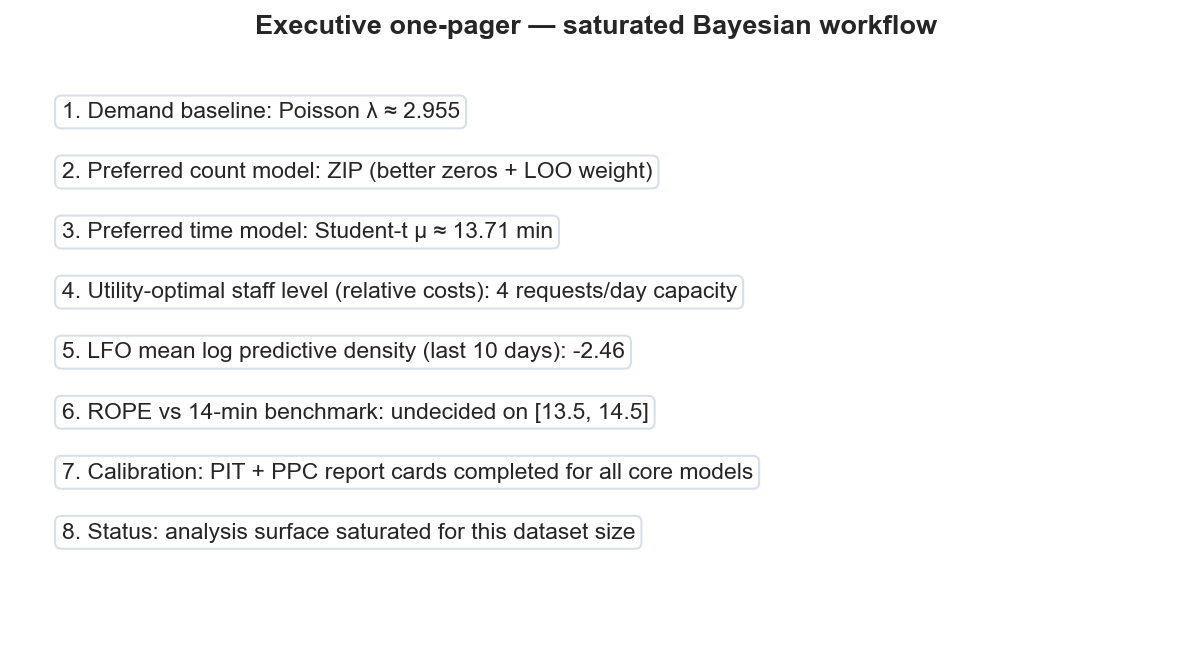
Poisson λ
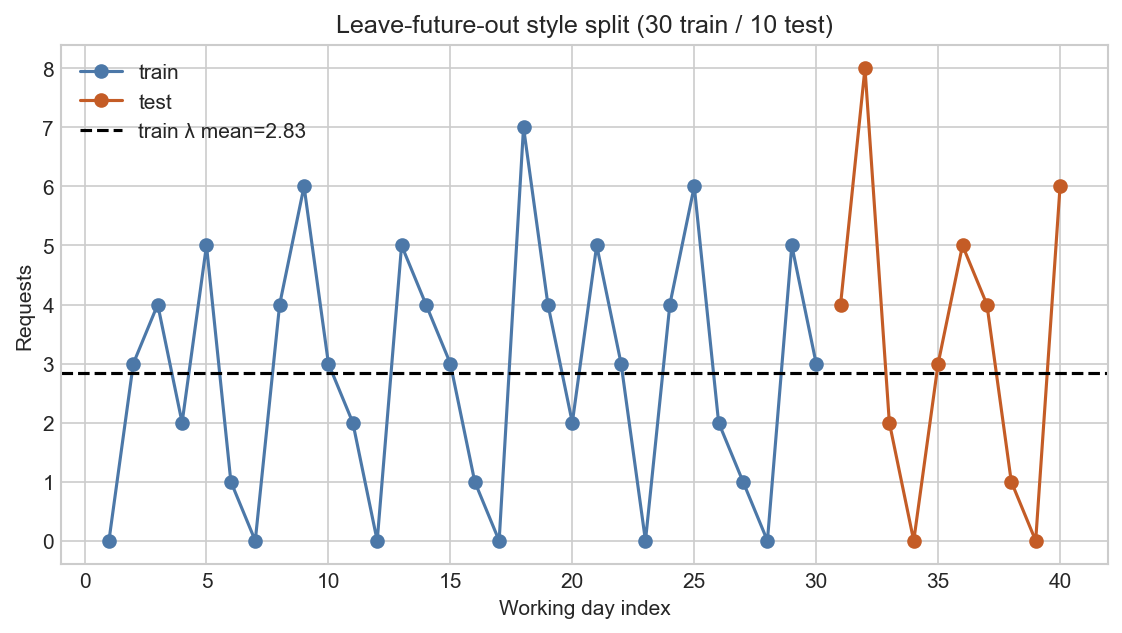
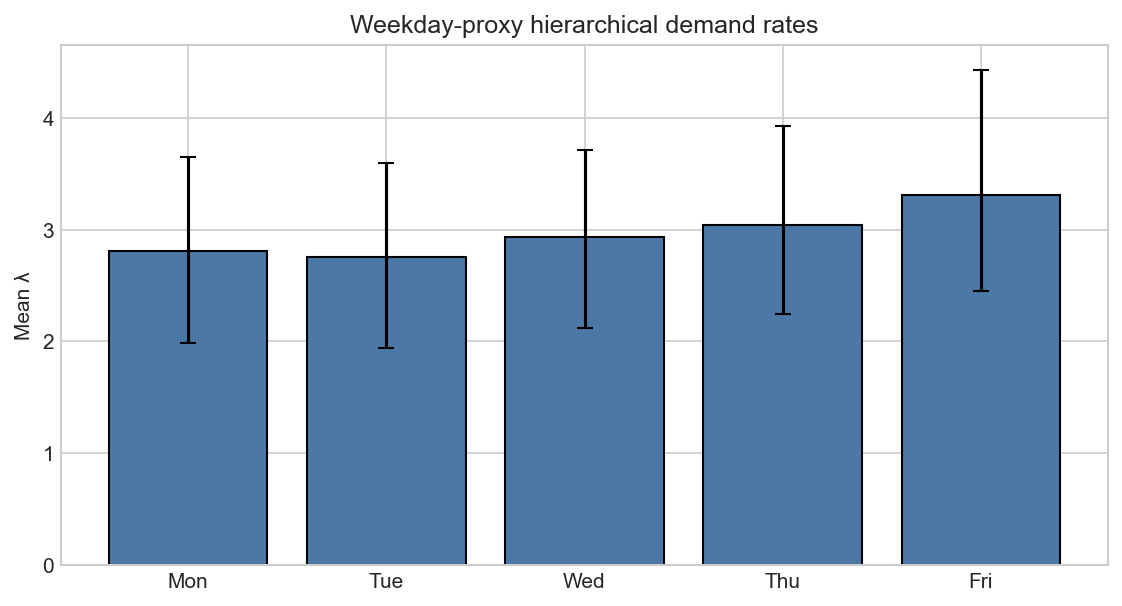
0Baseline daily demand
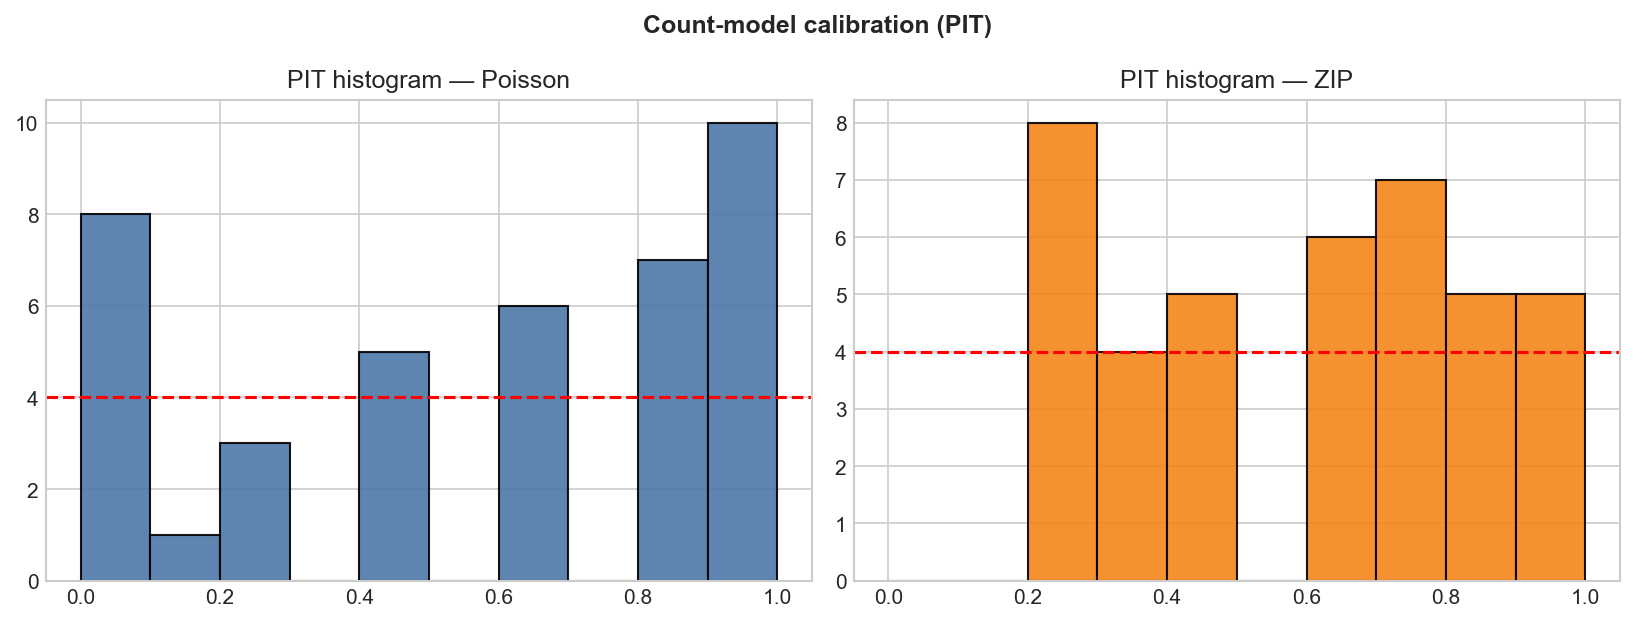
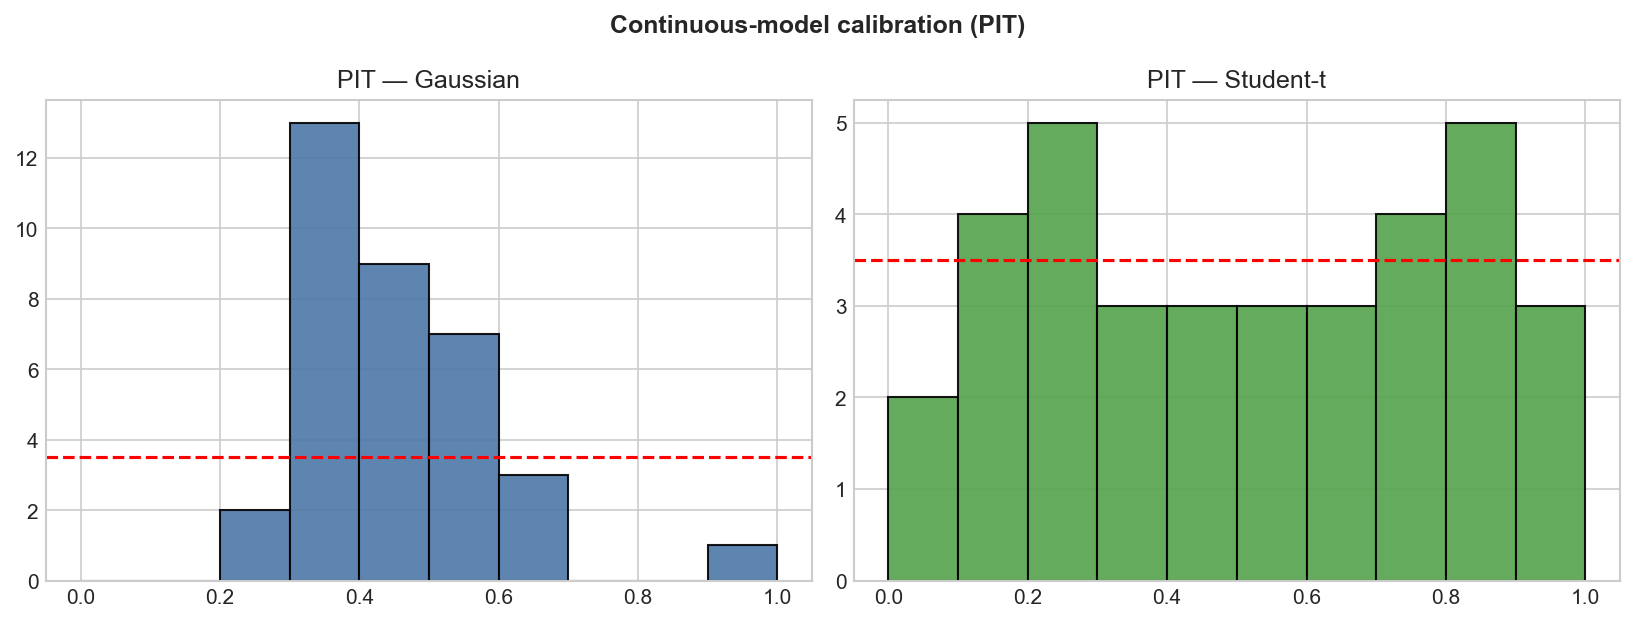
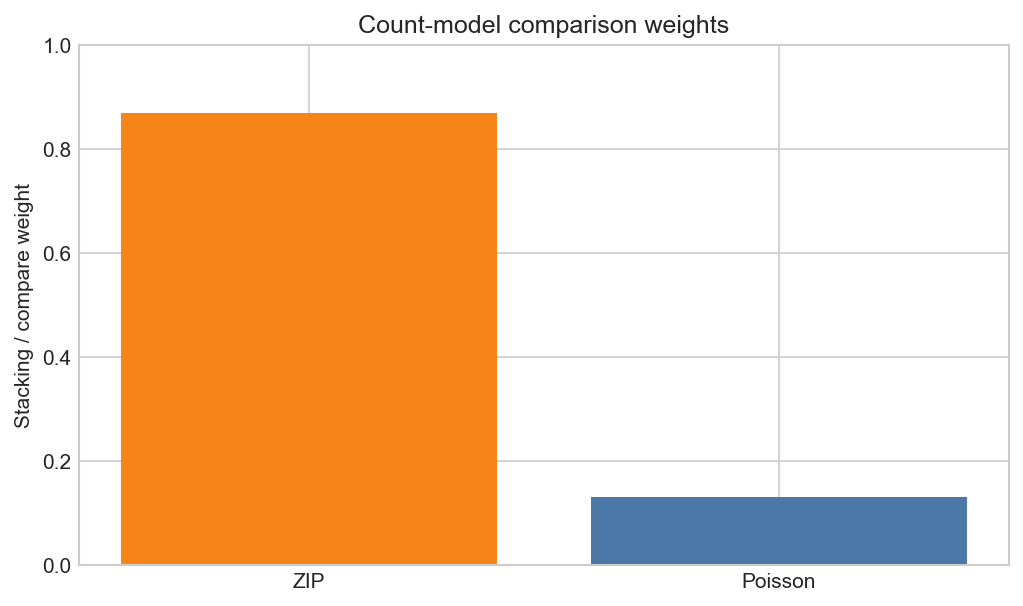
Interactive decision view generated from the final Bayesian notebook outputs. Toggle theme, inspect KPIs, and review calibration/policy visuals.
Baseline daily demand
LOO/weight preferred
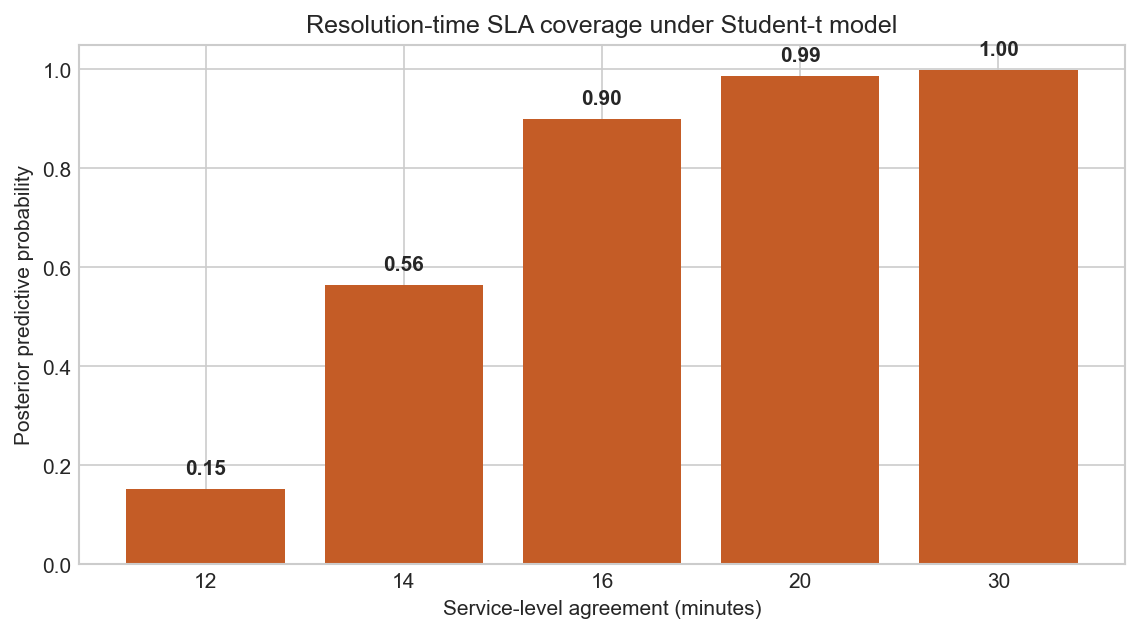
Typical resolution time
Relative cost minimum
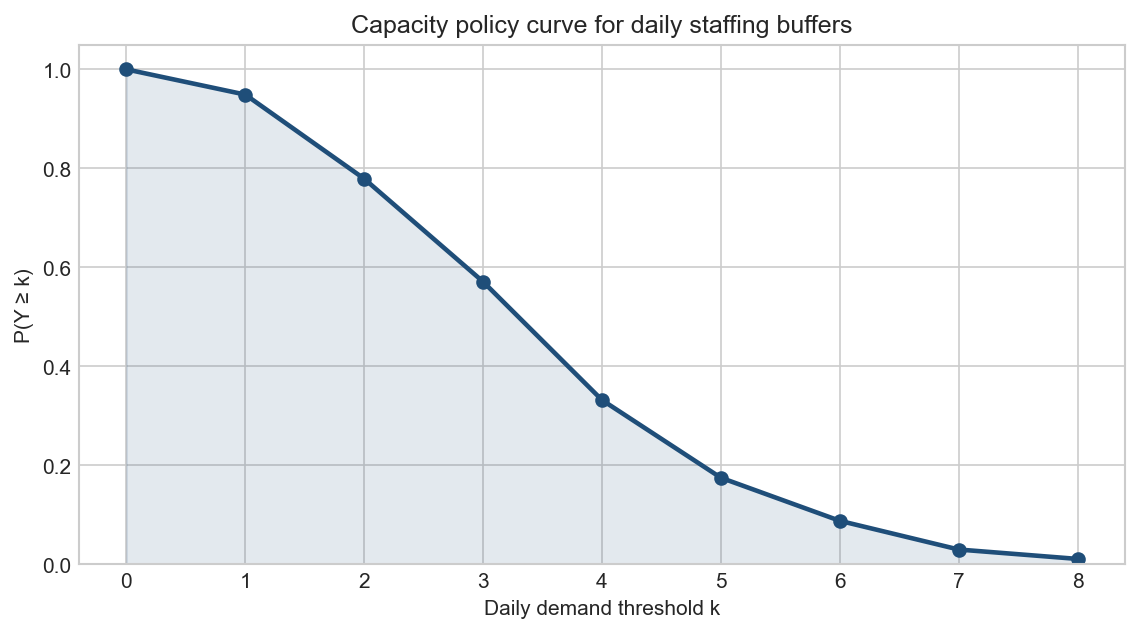
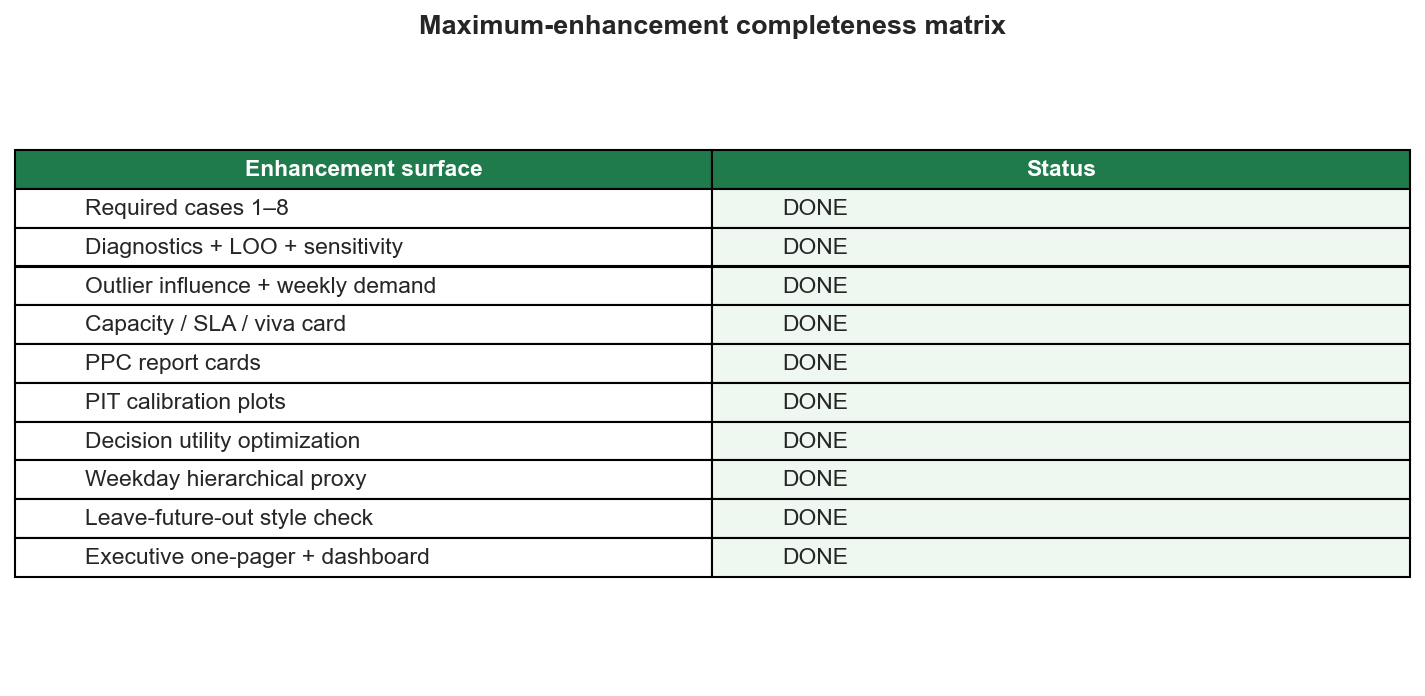
Switch between calibration, staffing utility, and completeness views.
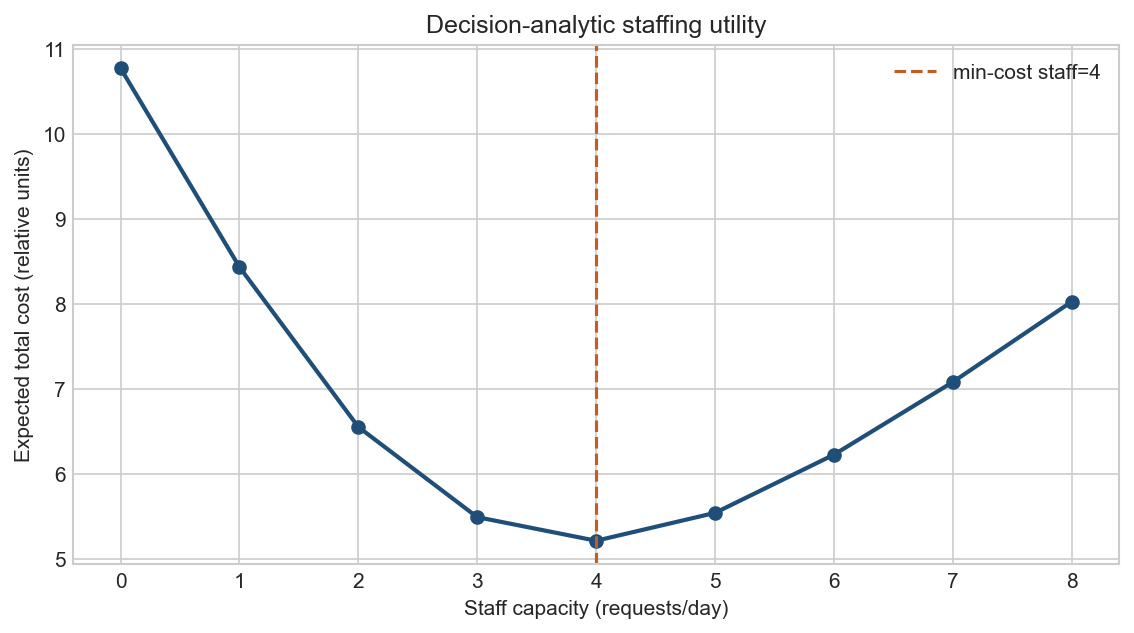
Expected shortfall and relative total cost by staff capacity. Minimum cost at staff level 4.
| staff_level | E_shortfall | P_shortfall | expected_total_cost |
|---|---|---|---|
| 0 | 3.077 | 0.954 | 10.770 |
| 1 | 2.123 | 0.824 | 8.431 |
| 2 | 1.300 | 0.589 | 6.548 |
| 3 | 0.711 | 0.365 | 5.487 |
| 4 | 0.345 | 0.192 | 5.209 |
| 5 | 0.153 | 0.090 | 5.537 |
| 6 | 0.064 | 0.042 | 6.222 |
| 7 | 0.022 | 0.015 | 7.077 |
| 8 | 0.006 | 0.005 | 8.023 |